Measuring Rheological Properties of Polymers with Rotation Rheometer
In general, many relevant properties can be characterized by rheological tests. The main purpose of using a rheometer to determine the rheological properties of a material (such as flowability, elasticity, and fracture properties) is:
1. Characterization of the material structure, including qualitative and quantitative analysis of the molecular weight and molecular weight distribution of the polymer, and analysis of the branching properties, filling properties, tensile properties, and glass transition temperature of the polymer.
2. Simulate the processing conditions of the polymer and evaluate the processability of the polymer. Through the analysis of the processing process, the correct selection of processing conditions and guidance for formula design.
3. Evaluate the performance of raw materials, semi-finished products and final products.
Test Techniques To ensure the accuracy of rheological testing of the polymer melt, a suitable rheometer, temperature control unit, and suitable measurement clamp need to be selected.
1. The rheometer Physica MCR rheometer is equipped with a unique electronic rectification synchronous motor motor, using a permanent magnet driver. At the same time, high-precision air bearings, optical encoder disks, and normal stress sensors make it extremely sensitive and instantaneously responsive. The torque range of the rheometer is up to 7 orders of magnitude, and the speed range is up to 10 orders of magnitude. The absolute inertia correction feature makes it have excellent measurement performance even at high frequency oscillations. Therefore, true strain control and stress control can be realized on the same rheometer.
To reduce measurement errors, the latest Physica MCR rheometer is also equipped with the Toolmaster automatic identification system. When the rotor is installed, the instrument automatically recognizes the size and serial number. Replace the temperature control unit and the host will automatically update the information. In this way, there will be no case of mixing 25mm and 50mm diameter rotors, so that the instrument has the advantages of error-free and intelligent.
2, temperature control unit In general, the typical temperature range of polymer rheological testing is 150 ~ 300 °C, which is the more sensitive polymer temperature range. For many samples, even if the temperature changes by 1°C, the change in viscosity will reach 5%. Therefore, the temperature needs to be strictly controlled in the rheological test. In general, only a few temperature control units can adapt to the requirements of polymer rheology testing, and the use of open temperature control methods and passive thermal insulation temperature control methods can not replace the closed temperature control unit that controls the temperature up and down (as shown in Figure 1) ).
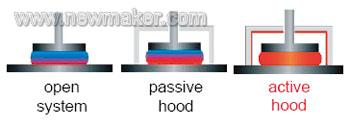
Fig. 1 Comparison of open temperature control, passive insulation and closed temperature control units with active temperature control up and down
(1) For polymer melts, one option is to use a measuring plate heating method with an upper electric heating shield and lower electric heating. AntonPaar offers two temperature range electric heating temperature control units: P-ETD350 (maximum temperature 350 °C) and P-ETD400 (maximum temperature 400 °C). This heating method is efficient, fast, and easy to use, and this heating method is used to fill the gas (such as nitrogen), help to quickly reach the control temperature, to avoid oxidation. In addition, temperature gradients inside the sample can also be avoided. In general, the polymer pellets can be directly placed on the lower heating plate. After the temperature equilibrium is reached, the measuring rotor is immediately lowered to the sample-squeezing position, and then a spilled sample is scraped off by a spatula to measure, and then the copper brush is used after measurement. Or the scraper cleans the upper and lower plates.
(2) CTD high-temperature furnaces that use radiation plus convection, such as the Anton Paar CTD450 temperature control unit. Due to the design features of the CTD high-temperature furnace, the measurement rotor and the sample are directly heated by gas heating instead of being placed on the lower plate, so this heating method has a longer closed-cycle temperature control than the electric heating, and can directly measure the sample temperature. In addition, the fully symmetrical design features of the CTD high temperature furnace minimize temperature gradients. This temperature control unit is not only suitable for measuring polymer melts, but also for solid DMTA testing, tensile testing and UV curing testing.
3. Measuring fixture Compared with the board measuring system, the advantage of the cone-plate measuring system is that the entire measuring gap has the same shear rate. However, since the gap between the cone plates is usually maintained at about 50 μm (cone plate system with a cone angle of 1°), experiments conducted at temperatures above or below room temperature pose a problem: if the temperature is increased or The cooling experiment results in thermal expansion and contraction, which inevitably causes millimeter-scale length changes in the axis of the rheometer support and measurement system, resulting in measurement errors. Therefore, the vast majority of scientific experiments use a board measurement system (it has a gap of 1000 μm).
However, a recent new measurement method (TruGap) can directly test and adjust the upper/lower cone/plate or plate gap in the range of -150 to 280°C. This temperature range is of great interest to polymer rheologists. The TruGap cone and plate system has a maximum gap error of no more than 1 μm over the entire temperature range.
Applications 1. Complete Flow Curve: Measurement of Zero-Shear Viscosity and Flowability of Thermoplastic Materials Flow and viscosity curves reflect the flow properties of thermoplastic materials under different shear and processing conditions. Most polymers are processed using plastic molding, which covers a wide range of shear rates (see table). In order to simulate the fluidity of different processing processes, it is necessary to measure the viscosity at the shear rate during the processing.
As shown in Figure 2, at low shear or low angular frequencies, the viscosity of the polymer is independent of the shear rate or angular frequency, ie there is zero shear viscosity. The zero shear viscosity is an important material parameter and is directly proportional to the 3.4th power of the average molecular weight Mw.
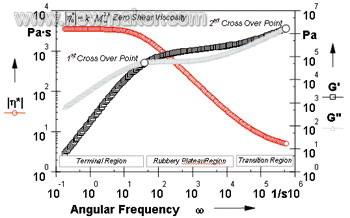
Figure 2 Polymer flow curve
2. Polymer Weight Average Molecular Weight and Qualitative Determination of Molecular Weight Distribution In frequency sweep analysis, the qualitative analysis of weight average molecular weight and molecular weight distribution can be judged from the intersection of storage modulus and loss modulus. In general, this experiment takes approximately 5 to 10 minutes. The horizontal position of the Gx at the modulus intersection can be used to qualitatively analyze the average molecular weight. The vertical position of Gx indicates the MMD of the molecular weight. In addition, the degree of branching is also related to the horizontal shift of Gx compared to similar polymers (as shown in Figure 3).
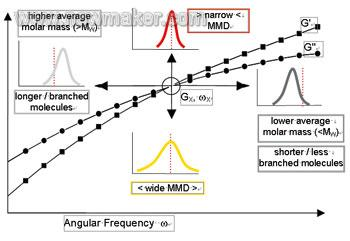
Figure 3: Qualitative analysis of molecular weight using the intersection of energy storage and loss modulus
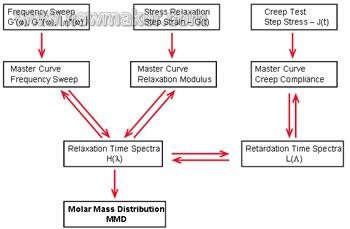
Figure 4 Polymer Analysis Module
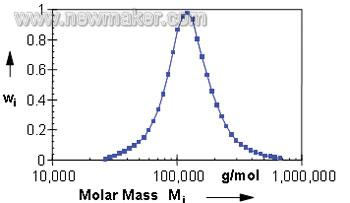
Fig. 5 Molecular weight and distribution of polymers calculated by rheology
4. Branched polymers Generally, the number, length, and mobility of side chains all affect rheological properties. If the side chain is not long, it will result in an increase in viscosity at low shear rates. The shear thinning effect is more pronounced than the corresponding linear polymer. For long-branched polymers, low viscosity will be exhibited at low shear rates. Therefore, the product performance can be controlled by controlling the degree of branching.
The degree of branching of the polymer can usually be analyzed using tensile tests. Rotary rheometers with excellent control rate performance, such as the Physica MCR301 from Anton Paar GmbH, Austria, can be configured with melt stretching dies to directly measure the tensile properties of the polymer, reflecting the difference in the degree of branching of the sample. For this difference, it is difficult to tell which flow curve or oscillation frequency sweep curve is usually used.
Figure 6 shows the difference between branched polypropylene (B-PP) and high regularity linear polypropylene (H-PP). Both polypropylenes have a melt index MI of 3 and the viscosity curves are basically the same. Under certain tensile stress, the molecular structure of the two polypropylenes showed a significant difference. Among them, the branching polypropylene (B-PP) showed a pronounced branching effect and tensile hardening (as shown in Fig. 6a), while the elongation of the high-linearity polypropylene (H-PP) did not increase significantly. Large (as shown in Figure 6b).
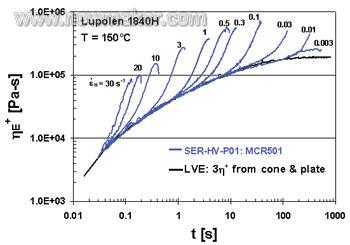
Figure 6 Tensile rheological tests of branched polypropylene and linear polypropylene at different draw rates
6. Solids test: The glass transition temperature and crystallisation temperature are analyzed by means of a temperature sweep. The rheometer can perform a torsion test on solids (or “dynamicsâ€) with a suitable solid fixture (solid sample bar fixture STBF or fiber film fixture FFF). Thermomechanical analysis DMTA"). In general, solid properties are related to temperature, and testing them helps to gain insight into the morphology and performance of the sample. Measurements of the glass transition temperature (Tg) and the storage modulus (G') below the transition temperature can yield information on maximum operating temperature, impact strength, brittleness, and rigidity. For crystalline or partially crystalline polymers, the melting temperature (Tm) is another important material parameter. The DMTA test can simultaneously obtain the melting temperature data (as shown in Figure 7).
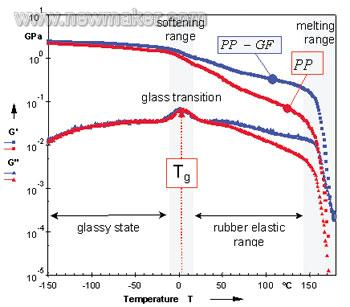
Figure 7 DMTA testing of polypropylene and glass fiber reinforced polypropylene
7. Transient testing: testing the time-response stress of the material Step changes (creep and recovery), strain step changes (stress relaxation) and velocity step changes (stress increase/start flow) can characterize the material for a given shear stress, shear The time (instantaneous) response of the shear strain or shear rate. The analysis method involves calculating some important material parameters such as: zero shear viscosity, plateau modulus, creep compliance, and converting the transient material function into the dynamic material function G'(ω)G" (ω). Shown as an example of a stress increase test.
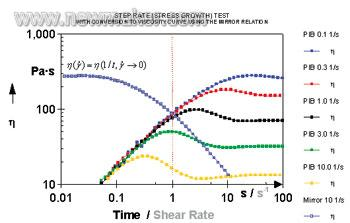
Fig. 8 Transient test of polymer solution
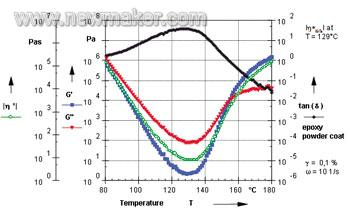
Figure 9 Curves of Thermosetting Epoxy Resin with Temperature
In addition, the rheometer can also measure the curing reaction or chemical reaction, for example, epoxy curing or UV curing, etc., and can determine the complete curing reaction dynamic state through the isothermal curve or setting the heating rate. The parameters involved include: The minimum softening viscosity, gel point, curing time and curing temperature.
Conveyor Frames
Established in 1976 in China, JUXIN, are considered as the first Conveyor and components: roller, frame, pulley manufacturer in Hengshui, China. The rapid growth of the business in China soon created the need for a distribution depot, therefore in 2007 a new branch was put in place in Tianjin City The modern day JUXIN now manufactures conveyor products to suit all supplies of mining, steel plant, cement plant, quarry, crushing and screening equipment. Our expertise and knowledge allows us to deliver fully on our promises of providing quick answers to your enquiries, rapid service, high quality products and above all, we are fully committed to be the best at what we do Service Agents are also located in: UK, South Africa, Kenya, Indonesia, Thailand, Kazakhstan All products are underpinned by unmatched customer service and prompt, reliable delivery. Our internal quality systems are designed to ensure that all orders are handled quickly and are manufactured to the ultimate quality standards. Several checking processes are in place prior to orders being released from the factory. Many tightly controlled inspections occur during the production processed.
Conveyor Frames,Conveyor Idler Frames,Belt Conveyor Frames,Belt Conveyor Bracket Frames
Hebei Juxin Conveyor Engineering Co., Ltd , https://www.juxinconveyor.com